
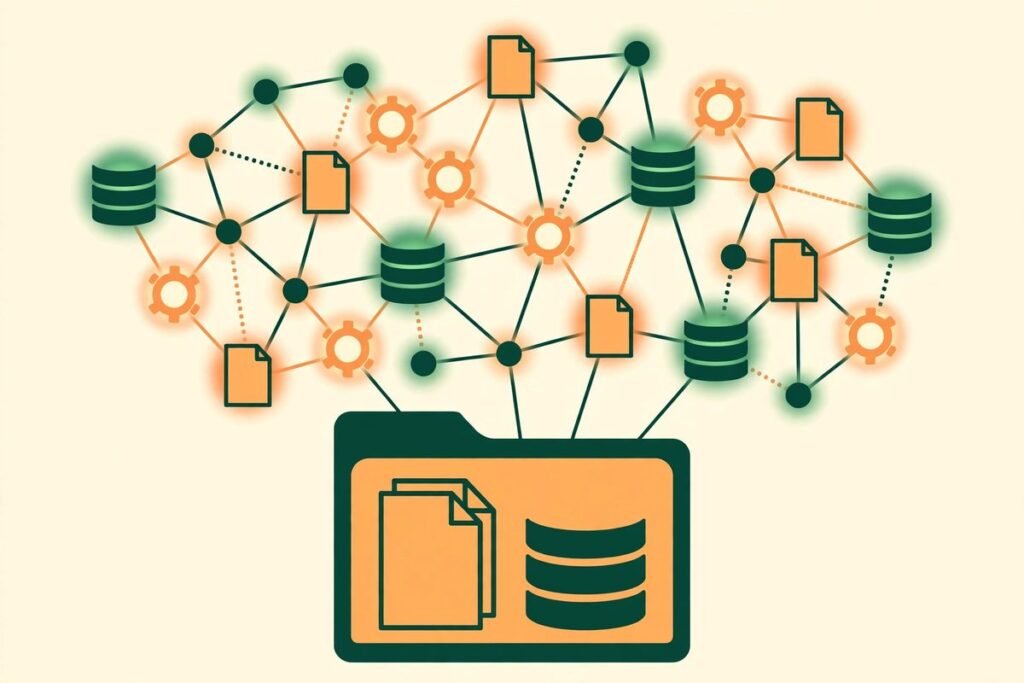
Graphify is a codebase to knowledge graph AI tool that turns a messy folder of code, documentation, database schemas and PDFs into a single map you can actually query. If you have ever opened a legacy codebase and found three conflicting answers in the code, the docs and an old chat thread, you know the problem it solves. At the time of writing, the Graphify repository on GitHub has 135,955 stars and 12,972 forks, is written mainly in Python, and is released under the Apache 2.0 licence. That star count alone does not make it production-ready, but it shows how many developers feel the pain of context loss when they hand a large codebase to an AI coding assistant.
This is written for engineering leads and developers who already use AI coding tools and keep hitting the same wall: the assistant is only as good as the context you give it. Paste ten files and you get a decent answer. Spread the answer across fifty files, five documents and a database schema, and the assistant guesses. Graphify tries to replace that guessing with a structure the assistant can navigate.
What Graphify actually is
Graphify describes itself as a skill for Claude Code, Cursor, Codex and Gemini CLI, and that framing matters. It is not a standalone chat app or a hosted search service. You install it, point it at a folder, and it builds a knowledge graph from source code, Markdown, plain text, PDFs, configuration files, SQL schemas and even images such as screenshots and diagrams. The output is files you own: an interactive graph, a report, a persistent JSON graph and, optionally, a Wikipedia-style wiki an agent can crawl.
The most useful idea in the project is also the most honest one. Every edge is tagged EXTRACTED, INFERRED or AMBIGUOUS: found in the source, reasoned to, or uncertain. That distinction separates a useful map from a confident hallucination. Too many retrieval tools hide uncertainty; Graphify puts it in the graph, so a developer or an agent can decide how much weight to give a link. Never trust a generated codebase map that does not tell you what it found and what it guessed.
How codebase to knowledge graph AI works in Graphify
Graphify uses two very different extraction methods, and the split explains both its strengths and its limits. Code is parsed locally and deterministically with tree-sitter, plus a call-graph pass: no language model guessing at calls, imports and structure. Documents, papers and images go a different route, with Claude extracting concepts and relationships, including from screenshots and diagrams. That is powerful, and it is also where inference, and therefore error, enters the picture.
Supported code languages include Python, TypeScript, JavaScript, Go, Rust, Java, C, C++, Ruby, C#, Kotlin, Scala and PHP. Markdown, plain text and reStructuredText documents are supported, PDFs get citation mining, and images are processed with Claude vision. The stack is NetworkX plus Leiden community detection, tree-sitter, Claude and vis.js. No vector store or Neo4j server is required, though GraphML and Cypher exports are available. For most teams that file-based design is a genuine advantage: the graph lives in your folder, not in another service to provision and pay for.
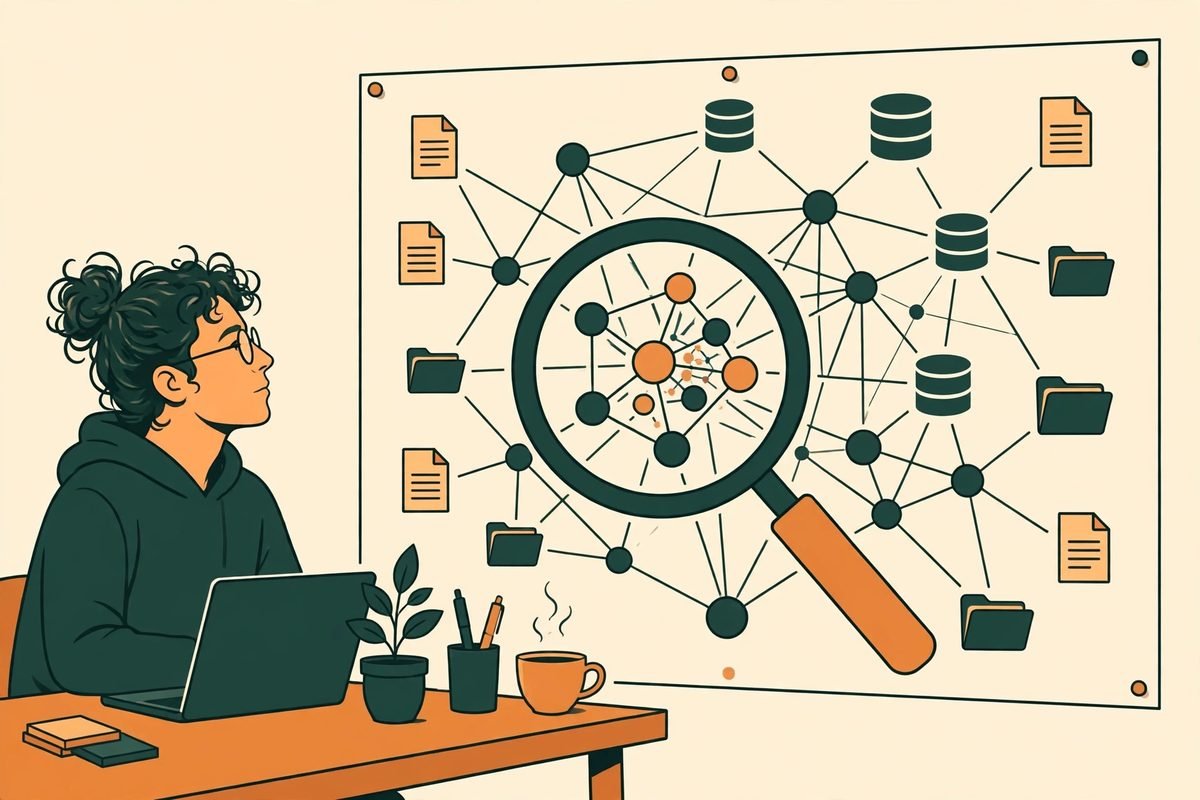
What it can do, in concrete terms
- Build a queryable graph from any folder. Run it on a codebase or research folder and get nodes for concepts, functions, files and ideas, with edges explaining how they connect.
- Surface god nodes and surprising connections. The report highlights the highest-degree concepts everything else connects through, and ranks surprising connections, with code-to-paper edges above code-to-code edges, each with a plain-English explanation.
- Suggest questions only this graph can answer. After a run, Graphify proposes four or five questions the graph is uniquely positioned to answer: a practical test of whether it captured anything new.
- Answer questions without re-reading everything. Query, path and explain commands let you ask what connects two ideas or explain a node, using the stored graph rather than re-reading raw files.
- Stay current as files change. Watch mode rebuilds instantly on code changes and prompts for a re-pass on documents or images. A post-commit hook rebuilds on every commit, and update mode re-processes only changed files via a SHA256 cache.
- Export in formats agents and humans can use. Alongside the interactive HTML graph, you get an Obsidian vault, a Markdown wiki, a JSON graph, SVG and GraphML exports, and an MCP server mode.
How it works: setup and first run
Graphify requires Claude Code and Python 3.10 or later. The documented install uses PyPI, noting the package is currently named graphifyy while the graphify name is being reclaimed; the skill command itself remains graphify. A manual route copies the skill file into your Claude skills folder. Read the current README before you install, because commands in a project growing this quickly can change between releases.
- Install the package and run the install command in a terminal, following the current README for your operating system.
- Open Claude Code in the directory you want to map, or point the tool at a specific folder.
- Run the graphify command on that folder and wait for the graph, report and JSON output to appear in the output directory.
- Open the interactive graph, check the god nodes, and read the suggested questions. If the graph looks wrong, check whether suspicious edges are INFERRED or AMBIGUOUS before blaming the code parser.
- Try a query, a path trace and an explanation on a question you already know. That calibration tells you how much to trust the tool on questions you do not know.
- Only then enable watch mode or the git hook so the graph updates as the codebase changes.
That calibration step is not optional. On a small repository, Graphify itself is candid that the benefit is structural clarity rather than token savings. Its worked examples show roughly 1x on a six-file library, 5.4x on a four-file mixed corpus, and 71.5x fewer tokens per query on a 52-file mixed corpus of repositories, papers and images. Token savings scale with corpus size. If your codebase already fits in a context window, judge this tool on navigation and onboarding, not compression.
Why it is trending now
Graphify is trending because it sits where three frustrations meet. AI coding assistants are now good enough that teams want to point them at whole repositories, not single files. Context windows are still a bad way to hold a whole system in mind: reading everything is expensive, slow and noisy. And vector search retrieves similar text but does not explain how parts of a system relate. A knowledge graph promises structure, with named relationships and a trail back to the source.
The project also leans into a real workflow: a raw folder of papers, tweets, screenshots and notes that grows beyond what anyone can hold in their head. That is a daily problem for research teams and agencies inheriting client code. It is why the multimodal angle matters: much real system knowledge lives in diagrams, screenshots and PDFs, not tidy Markdown.
Timing helps too. Agent skills have become a major trend in 2026, and Graphify ships as a skill inside the assistant teams already use, not as a separate platform. That low-friction trial path, plus a striking star count, is a classic recipe for trending status, but it is not proof of quality.
From our experience: where to be careful
At MTD Technologies, where we have shipped web, mobile and AI work for more than nine years across over 300 projects, the pattern is consistent: a mapping tool is only as trustworthy as its handling of uncertainty. Graphify gets the framing right by labelling inferred edges, but labelling is not fixing. A plausible-looking inferred edge can still mislead an agent that treats every edge as fact. Keep a human in the loop for anything touching money, security, data migration or production configuration, and treat AMBIGUOUS edges as questions, not answers.
Cost is the second reality check. Open source under Apache 2.0 means no licence fee, but not free to run: you need Claude Code, and document and image extraction use Claude, so budget for subscription or API costs plus engineer time to review the graph. A graph nobody maintains goes stale faster than documentation, because it looks authoritative while describing last month’s codebase.
Third, do not feed it secrets. Code parsing is local and deterministic, but documents and images are processed through Claude. Keep API keys, customer data and credentials out, or use an approved environment. The graph itself is also sensitive: do not publish it or commit it publicly without considering what it reveals about your internal systems.
Finally, watch maturity signals, not just stars. The repository lists over 1,600 open issues at the time of writing: normal for fast growth, but a reminder you are adopting a moving target. Check the tracker for your language or workflow, pin a version for a serious trial, and judge value with a one-repository trial on a question you can verify.
Who it is for, and who should skip it
Graphify is most useful for teams onboarding onto a large or legacy codebase, agencies inheriting thinly documented client systems, research teams with sprawling notes, and any team already using Claude Code heavily. If you work mostly on small, well-documented projects, or do not use Claude Code, the payoff is much smaller, and a good README plus disciplined code search may serve you better. If your organisation cannot approve model processing of internal documents, the document and image features are off the table until that approval exists.
For a practical next step, browse our AI Tools Directory for other agent and coding tools we have reviewed. Our AI integration and automation services cover this kind of evaluation work, and you can talk to us about an AI-assisted codebase audit before you commit to a new toolchain.
Frequently asked questions
What does Graphify do?
Graphify builds a knowledge graph from code, documents, PDFs, schemas and images, then lets you query it, trace paths between concepts, and export it as an interactive graph, wiki or JSON file. Code is parsed locally with tree-sitter; documents and images use Claude; every edge is labelled extracted, inferred or ambiguous.
Is Graphify free?
Graphify itself is open source under Apache 2.0, so there is no licence fee. Running it is not free in practice: it requires Claude Code and uses Claude for document and image extraction, so budget for subscription or API costs plus review time.
How is a knowledge graph better than vector search?
Vector search finds similar text. A knowledge graph records named relationships, so you can trace how two ideas connect, find central concepts, and see why a connection was made. That structure helps navigation, but only if inferred edges are clearly labelled, as Graphify does.
Does Graphify work without Claude Code?
No, not as documented. Graphify ships as a skill for Claude Code, with support noted for Cursor, Codex and Gemini CLI, and requires Claude Code and Python 3.10 or later. If your team does not use those assistants, skip it for now.
Should I trust the 71.5x token saving claim?
Treat it as a worked example, not a promise. It comes from a specific 52-file mixed corpus, and the project itself shows much smaller savings on tiny corpora. Measure it on your own repository, with a verifiable question, before quoting it.
The verdict
Graphify earns its attention because it tackles the real bottleneck in AI-assisted development, which is not model quality but context quality. A queryable map, with honest labels for what was found and what was guessed, beats dumping files into a prompt and hoping. It is not a replacement for documentation, code review or human judgement, and on a small codebase it may add more machinery than value. Try it on one real repository, calibrate it against a question you already know, and judge it by connections you did not already know. If you would like help running that evaluation, contact MTD Technologies.