
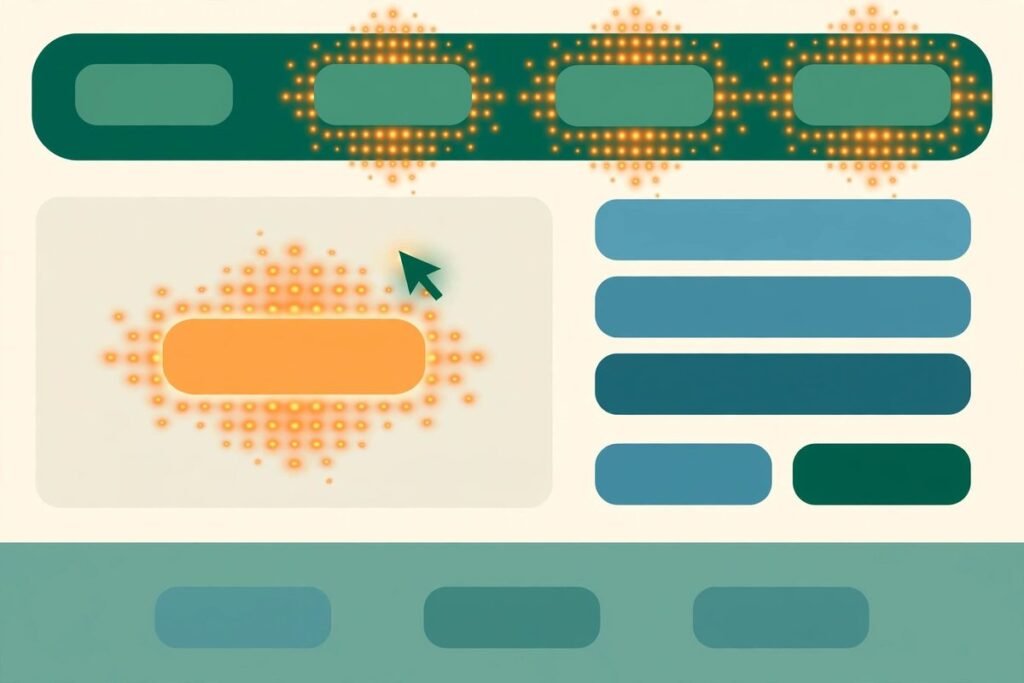
This website heatmap analysis guide is for business owners and marketers who already know something is wrong with a page but cannot see where visitors give up. A heatmap will not tell you what to think. It shows you, in colour, where visitors click, how far they scroll, and where they hesitate — and if you read it in the right order, it turns a vague complaint like “the page does not convert” into a short, fixable list. This guide explains how to read each type of map, the five patterns that most often point to lost conversions, and how to turn a pattern into a fix you can measure.
What a heatmap actually shows — and what it does not
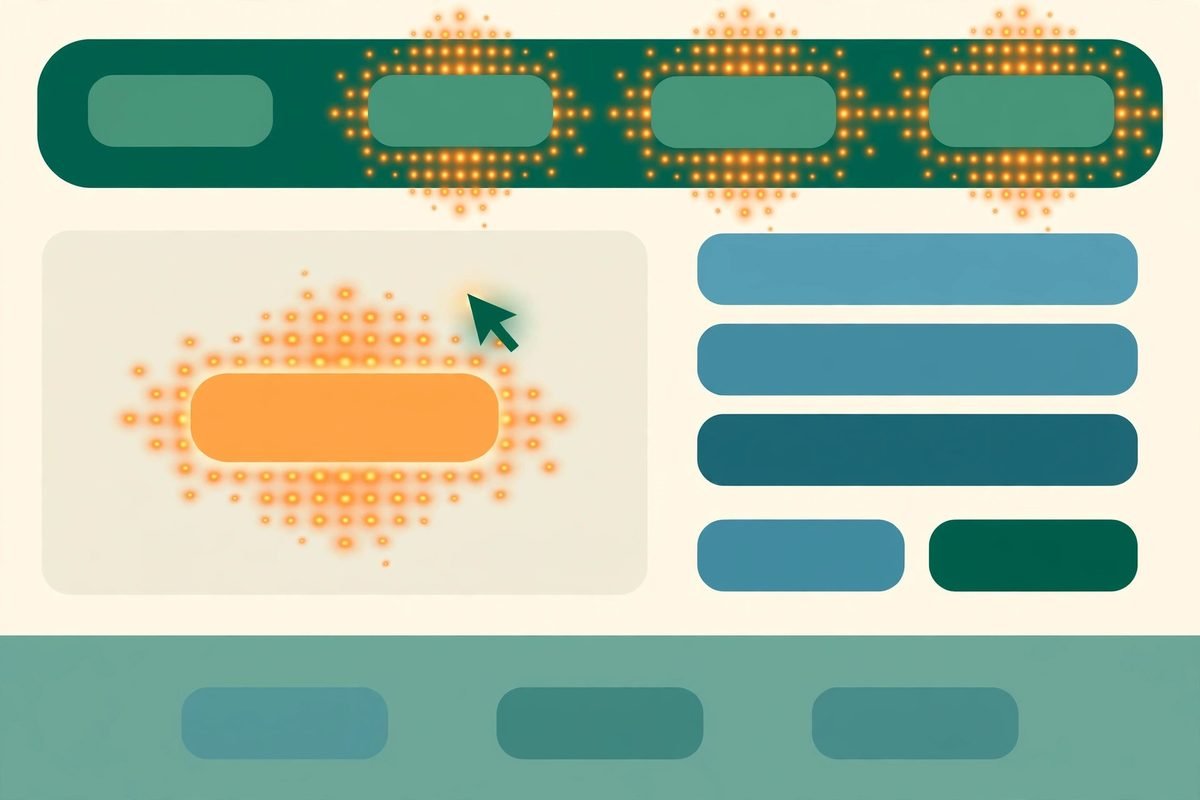
A heatmap is an aggregate picture of behaviour on one page. Hundreds or thousands of visits are layered on top of each other, so hot areas show where activity concentrates and cold areas show where almost nothing happens. That aggregate view is the whole point, and also the main trap: a heatmap shows where, not why. A bright cluster on a headline could mean visitors love it, or that they keep clicking it because they expect it to be a link. You cannot tell from the colour alone. Every pattern in this guide therefore ends with the same question: what will you check next — a session replay, a funnel step, or a small test?
There are three maps worth knowing, and they answer three different questions. A click map (or tap map on mobile) shows where visitors try to act. A scroll map shows how far down the page visitors actually get, usually as the share reaching 25, 50, 75 and 100 per cent of the page. A move map tracks cursor movement on desktop and is best treated as a rough proxy for attention, not as proof that anyone read anything. A sensible reading order is clicks first, then scroll, then movement, then session replays to confirm what the maps only suggest. That order is also the sequence recommended in practical guides to click, scroll and move heatmaps, which stress matching each map to the kind of evidence you actually need.
Before you read anything: get the setup right
Most bad heatmap conclusions come from bad setup, not bad reading. First, collect enough data. A map built from a few dozen visits mostly shows noise; wait until you have at least a few hundred visits on the page, and longer for low-traffic pages, before you rearrange anything. Second, always segment by device. Desktop and mobile visitors use the same page in completely different ways — a button that is obvious with a mouse can be a thumb-stretch on a phone, and cursor data does not exist at all on mobile. A combined map hides exactly the difference you need to see.
Website Heatmap Analysis Guide: A Practical Reading Method
Start with the goal of the page, stated in one sentence. For a service page it might be “visitor requests a quote”; for a product page, “visitor adds to cart”; for a blog post, “visitor reaches the call to action”. Every reading step below is judged against that sentence. A click that does not serve the goal is either a distraction or a signpost you have not understood yet.
- Step 1 — Check the primary call to action on the click map. What share of clicks does it get, and where does it rank against navigation links, images and footer links? A primary action buried below secondary links is a placement problem, not a copywriting problem.
- Step 2 — Read the scroll map against the call to action. If most visitors never reach the section that contains your main offer, no amount of button tweaking above the fold will fix it. Either the offer needs to move up, or the content above it needs to earn the scroll.
- Step 3 — Hunt for dead clicks and rage clicks. Dead clicks land on elements that are not interactive; rage clicks are rapid repeated clicks in one spot, usually on something that feels broken or unresponsive. Both are cheap to find and often cheap to fix.
- Step 4 — Combine clicks with scroll depth. Raw click counts mislead. A button seen by only a small share of visitors but clicked by most of them is performing well — it is a visibility problem, not a button problem. Judge every element by clicks relative to how many people actually saw it.
- Step 5 — Confirm with replays, then change one thing. Watch a handful of sessions that show the pattern, especially on the device where it is worst. Then ship a single fix and re-measure. Changing five things at once makes the next heatmap unreadable.
The five patterns that point to lost conversions
1. Clicks on things that are not clickable. Headlines, product images, icons and comparison-table headers attract clicks because visitors expect them to do something. When nothing happens, some visitors recover and click the real link; others leave. The fix is usually to make the element do what visitors expect — link the image to the detail view, for example — or to make it visibly non-interactive. Watch replays first: if visitors click and then immediately click the correct element, it is friction, not failure. If they click and leave, it is lost revenue.
2. Rage clicks and error clicks. Repeated clicking on a button that does nothing, or clicks that trigger JavaScript errors, are the clearest distress signal a heatmap tool produces. Segment by device and browser before you blame the design: a pattern that appears only on one browser is usually a bug, and a pattern that appears everywhere is usually a design that promises more than it delivers. Pair the map with your error logs, fix the underlying fault, and only then judge whether the element itself needs redesigning.
3. A cold primary call to action. When the main button gets little attention while navigation and secondary links run hot, one of three things is true: the button is hard to see, it sits below the point where most visitors stop scrolling, or the page has not yet answered the objection that would make someone click. Scroll data separates the first two from the third. If visitors reach the button and still do not click, the problem is the offer, the label or the perceived risk — “Get a quote” asks for more commitment than “See pricing”, and vague labels lose to specific ones.
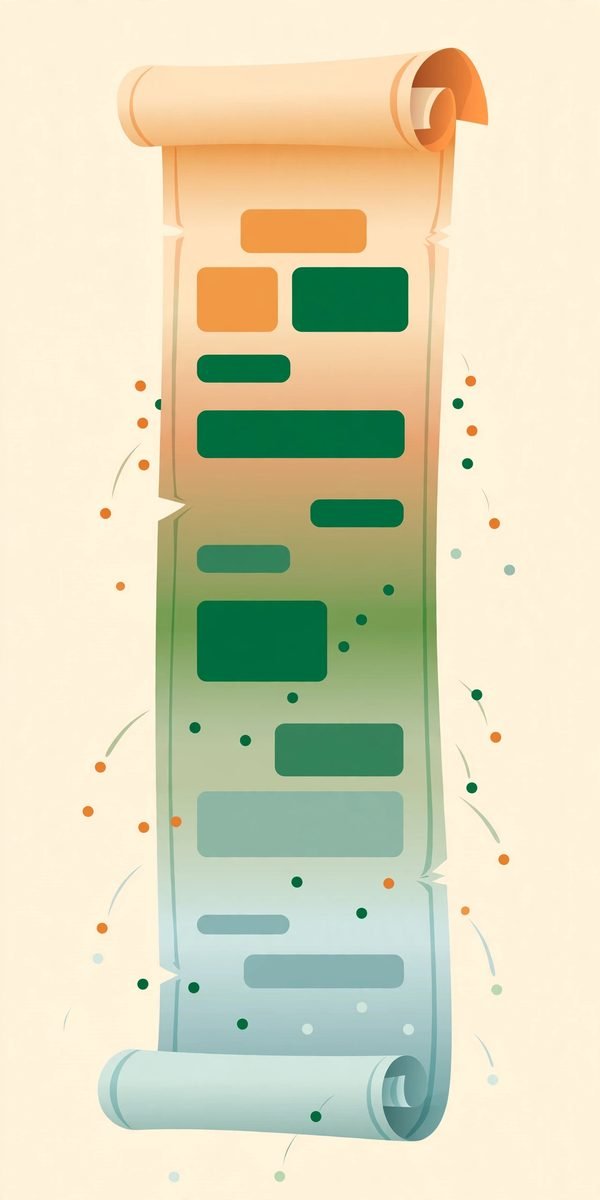
4. The false bottom. A sharp drop in scroll depth at a particular point often means the page looks finished when it is not: a full-width banner, a large image or a section break reads as the end of the page, so visitors stop. The fix is rarely to shorten the page. It is to break the visual “ending” — carry a partial element across the boundary, keep the next heading visible, or move a strong reason to continue into the section just above the drop. If the drop happens right after the hero, the hero itself is the problem: visitors decided in seconds that the page was not for them.
5. High clicks, low visibility — the hidden winner. This is the pattern most teams miss because raw heatmaps hide it. An element deep down the page may show only a faint warm patch, yet almost everyone who scrolls far enough to see it clicks it. That is a strong signal: the content works, the placement does not. Moving that element higher, repeating its core promise above the fold, or linking to it from the hero usually outperforms rewriting it. The same logic in reverse applies to elements everyone sees and nobody clicks — they are either irrelevant or their label promises the wrong thing.
From pattern to fix: prioritise, change, re-measure
Then measure the right thing. After a fix, the targeted pattern should weaken — fewer dead clicks, a warmer call to action, a shallower scroll drop — and the page’s goal conversion should move in the same direction. If the pattern improves but conversions do not, you fixed a symptom: the real objection is elsewhere, and the next step is qualitative — a survey, a handful of user interviews, or a closer look at the funnel step after the click. Heatmaps are a triage tool, not a verdict, and practical heatmap analysis for landing pages makes the same point: treat the map as a hypothesis generator, then validate with funnel data and replays.
Choosing a heatmap tool without overpaying
For most small and mid-sized business sites, the honest starting point is Microsoft Clarity: it is free, with heatmaps, session recordings and frustration signals, and no paid tier to grow into, which makes it an easy default while you learn the discipline. The trade-off, worth knowing before you install it, is that Microsoft’s terms allow aggregated, anonymised behavioural data to be used to improve its own products — a reason some healthcare, finance and public-sector teams choose a commercial alternative instead. Comparisons of the current market reflect this split clearly, including the Hotjar versus Microsoft Clarity comparison updated after Hotjar’s move into Contentsquare.
That move matters if you follow older advice: Hotjar no longer sells its own plans, and hotjar.com now redirects to Contentsquare — check its current pricing page before deciding, because this category reprices often.
From our experience: the mistakes we see most
After years of building and optimising business websites at MTD Technologies, the same heatmap mistakes recur. The most expensive is redesigning a page from a heatmap alone, without watching a single replay — colour suggests, replay confirms, and we have seen teams remove a “cold” section that replays showed visitors were reading carefully before converting by phone instead. The second is treating scroll depth as reading: scrolling to the bottom of a page is exposure, not engagement, and a long page with a low bottom-reach is not necessarily failing if its goal sits near the top. The third is ignoring mobile: a map that looks healthy on desktop can hide a checkout button that sits below a sticky banner on phones, and that is exactly the kind of fault that costs real orders while the aggregate numbers look fine.
Frequently asked questions
How much traffic do I need before a heatmap is trustworthy?
As a rule of thumb, wait for a few hundred visits on the page, and longer on low-traffic pages. Below that, individual visitors dominate the picture and you risk redesigning around noise. Segment by device from the start, because desktop and mobile behaviour differs too much to average together.
What is the difference between a click map and a scroll map?
A click map shows where visitors try to act; a scroll map shows how far down the page they get. Use clicks to judge whether calls to action and links work, and scroll depth to judge whether visitors ever see them. The most useful readings combine the two, judging clicks relative to how many people actually saw the element.
What are dead clicks and rage clicks?
Dead clicks land on elements that are not interactive, such as headlines or images visitors expect to be links. Rage clicks are rapid repeated clicks in one spot, usually on something that feels broken or unresponsive. Both are worth fixing quickly, but check device and browser segments first — a pattern on one browser is usually a bug.
Can heatmaps tell me why visitors leave?
Not on their own. Heatmaps show where behaviour concentrates; they do not explain motive. Pair a pattern with session replays, funnel data and, where needed, a short survey or user interview. Treat the map as the question, not the answer.
Which heatmap tool should a small business start with?
Microsoft Clarity is the usual starting point because it is free with no paid tier, covering heatmaps, recordings and frustration signals. Consider a commercial platform such as Contentsquare when you need surveys beside your heatmaps, longer retention, or a commercial data contract — and always check current pricing and data terms before deciding.